Case study: RNA-sequencing of liver tissue from double-crested cormorant (DCCO) embryos
This short tutorial below demonstrates how to run Seq2Fun. We use a RNA-seq dataset from a real non-model organism double-crested cormorant (DCCO), treated with ethinyl estradiol (EE2) as a show case.
1.1 An important html report to summarize all samples(please check it first) (Seq2Fun_summary_all_samples.html).
1.2 s2f id abundance for all the samples table (S2fid_abundance_table_all_samples.txt).
This table has s2f id, sample names and annotation separated by '\t'. (how many reads have assigned to the s2f id), the full name of the assigned s2f id annotation.
#NAME A1.CE2-S1 A3.CE1-M2 A4.CE1-H5 B1.CE2-S2 B3.CE1-M3 C1.CE2-S3 C3.CE1-M4 D1.CE2-S4 D3.CE1-M5 E1.CE2-S5 E3.CE1-H1 F3.CE1-H2 G3.CE1-H3 H2.CE1-M1 H3.CE1-H4 annotation2. The following tables and figures are from (Seq2Fun_summary_all_samples.html).
#CLASS:XX control middle high control middle control middle control middle control high high high middle high -
s2f_7617 158 338 475 130 329 178 342 185 479 160 312 429 241 309 345 K04198|GO:0004930;GO:0004962;GO:0005886;GO:0007165;GO:0007186;GO:0008217;GO:0016020;GO:0016021;GO:0042310;GO:0048484;GO:0086100|EDNRB|endothelin receptor type B
s2f_7570 10 9 9 8 1 8 23 8 23 9 9 7 15 7 12 K07437|GO:0004497;GO:0005506;GO:0016491;GO:0016705;GO:0020037;GO:0046872|CYP26A1|cytochrome P450 26A1
s2f_14150 0 1 0 0 0 0 0 0 0 1 1 0 1 0 0 K05254|GO:0005179;GO:0005576;GO:0007165;GO:0016608|GHRL|appetite-regulating hormone
s2f_6367 22 43 48 50 50 31 55 29 38 16 52 45 40 40 45 K03370|GO:0005794;GO:0006486;GO:0008373;GO:0016020;GO:0016021;GO:0016740;GO:0016757;GO:0097503|ST3GAL5|lactosylceramide alpha-2,3-sialyltransferase isoform X1
s2f_7077 42 81 44 63 61 61 63 66 60 83 46 65 72 74 51 U|GO:0000775;GO:0000776;GO:0005694|CFDP1|craniofacial development protein 1
s2f_12441 3 4 8 4 2 1 3 0 13 2 3 7 6 4 5 K15680|GO:0016491|HSD11B1L|hydroxysteroid 11-beta-dehydrogenase 1-like protein isoform X1
...
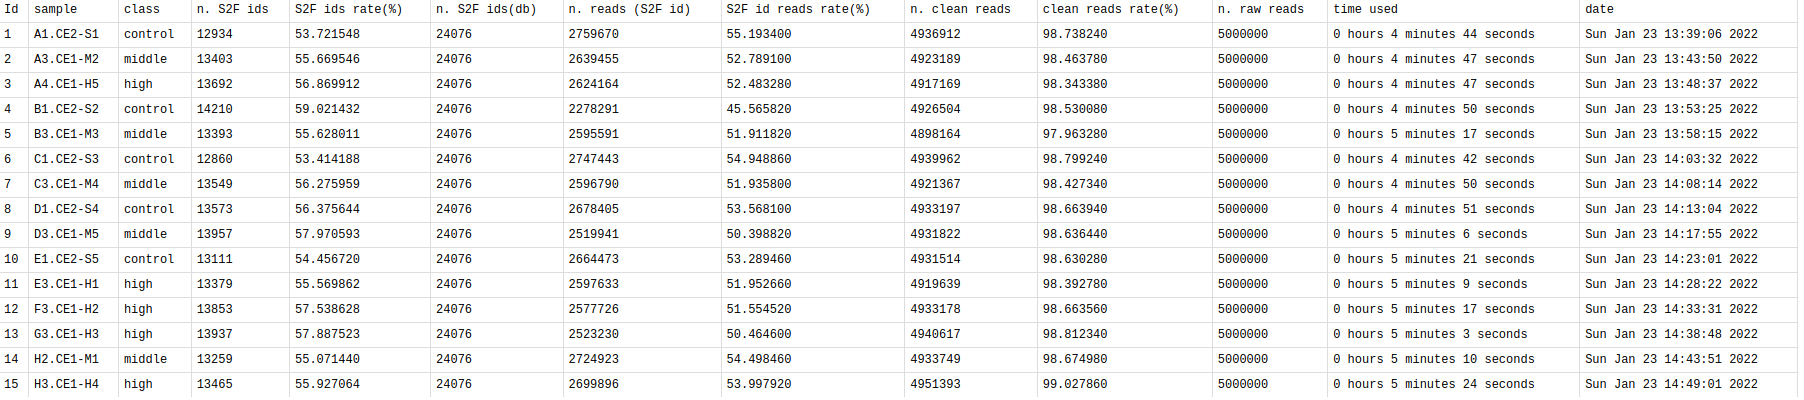 This table summarizes the general information of your samples.
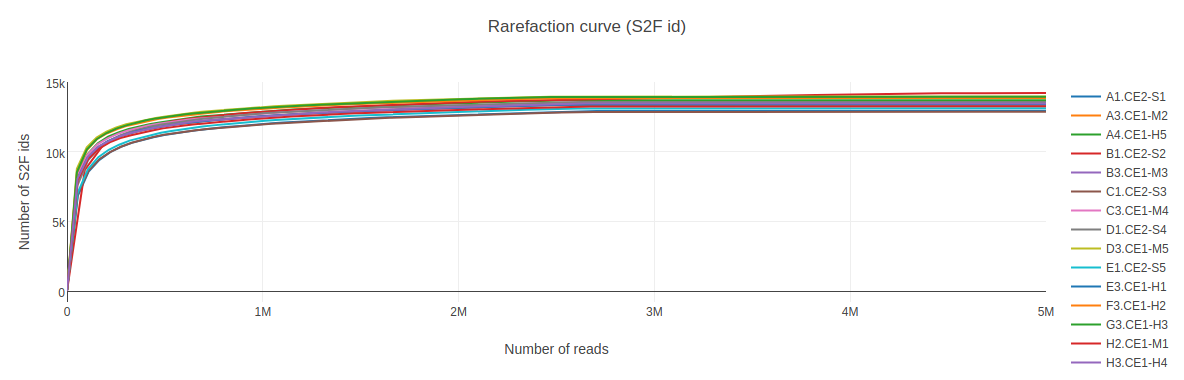 Rarefaction curve (2d) for all samples.
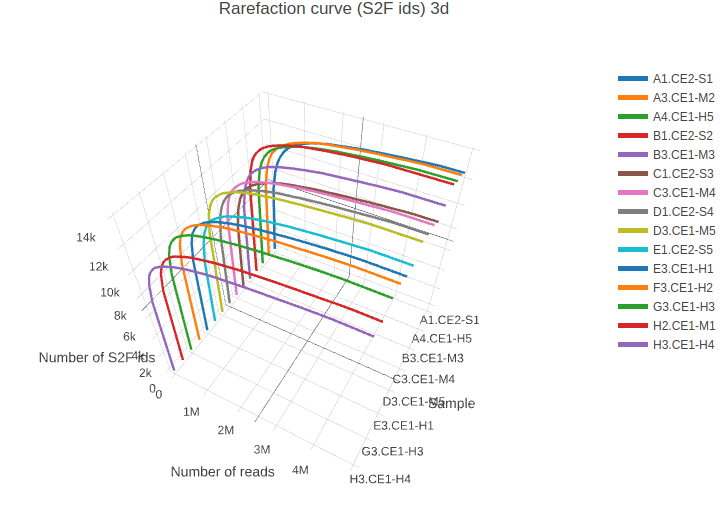 Rarefaction curve (3d) for all samples.
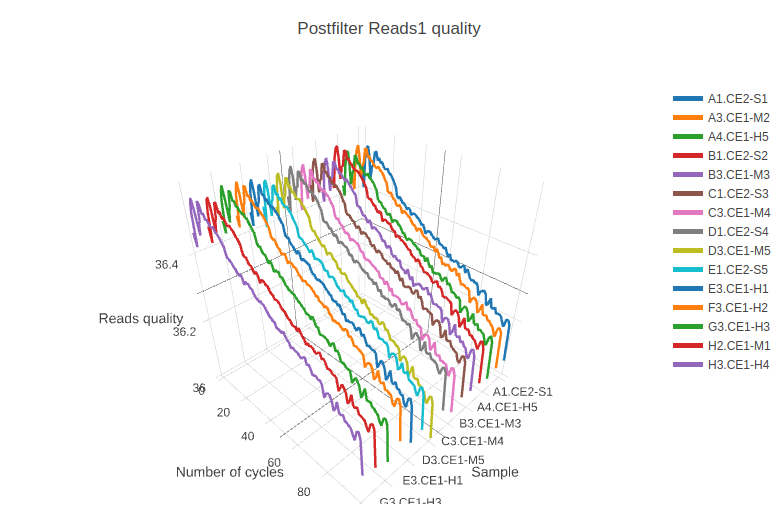 Reads quality (3d) for all samples.
1. Online website-based analysis tool ExpressAnalyst
S2fid_abundance_table_all_samples_submit_2_expressanalyst.txt, this will be used to submit to ExpressAnalyst.
2. Based on the KO abundance table generated by Seq2Fun (version 1, from verion 2, we provide the s2f id abundance table), differentially expressed KOs are
identified by limma (R package), and enriched pathways are analysized (GSEA) by HTSanalyzeR
(R package).
We provide the R script (click here to download) to conduct pathway enrichment.
Please note that the following figure is generated by HTSanalyzeR, which may no longer be installed on current R version.
Therefore, we have developed an alternative R script using fgsea for pathway analysis and we suggest users to try the casestudy_fgsea.R.
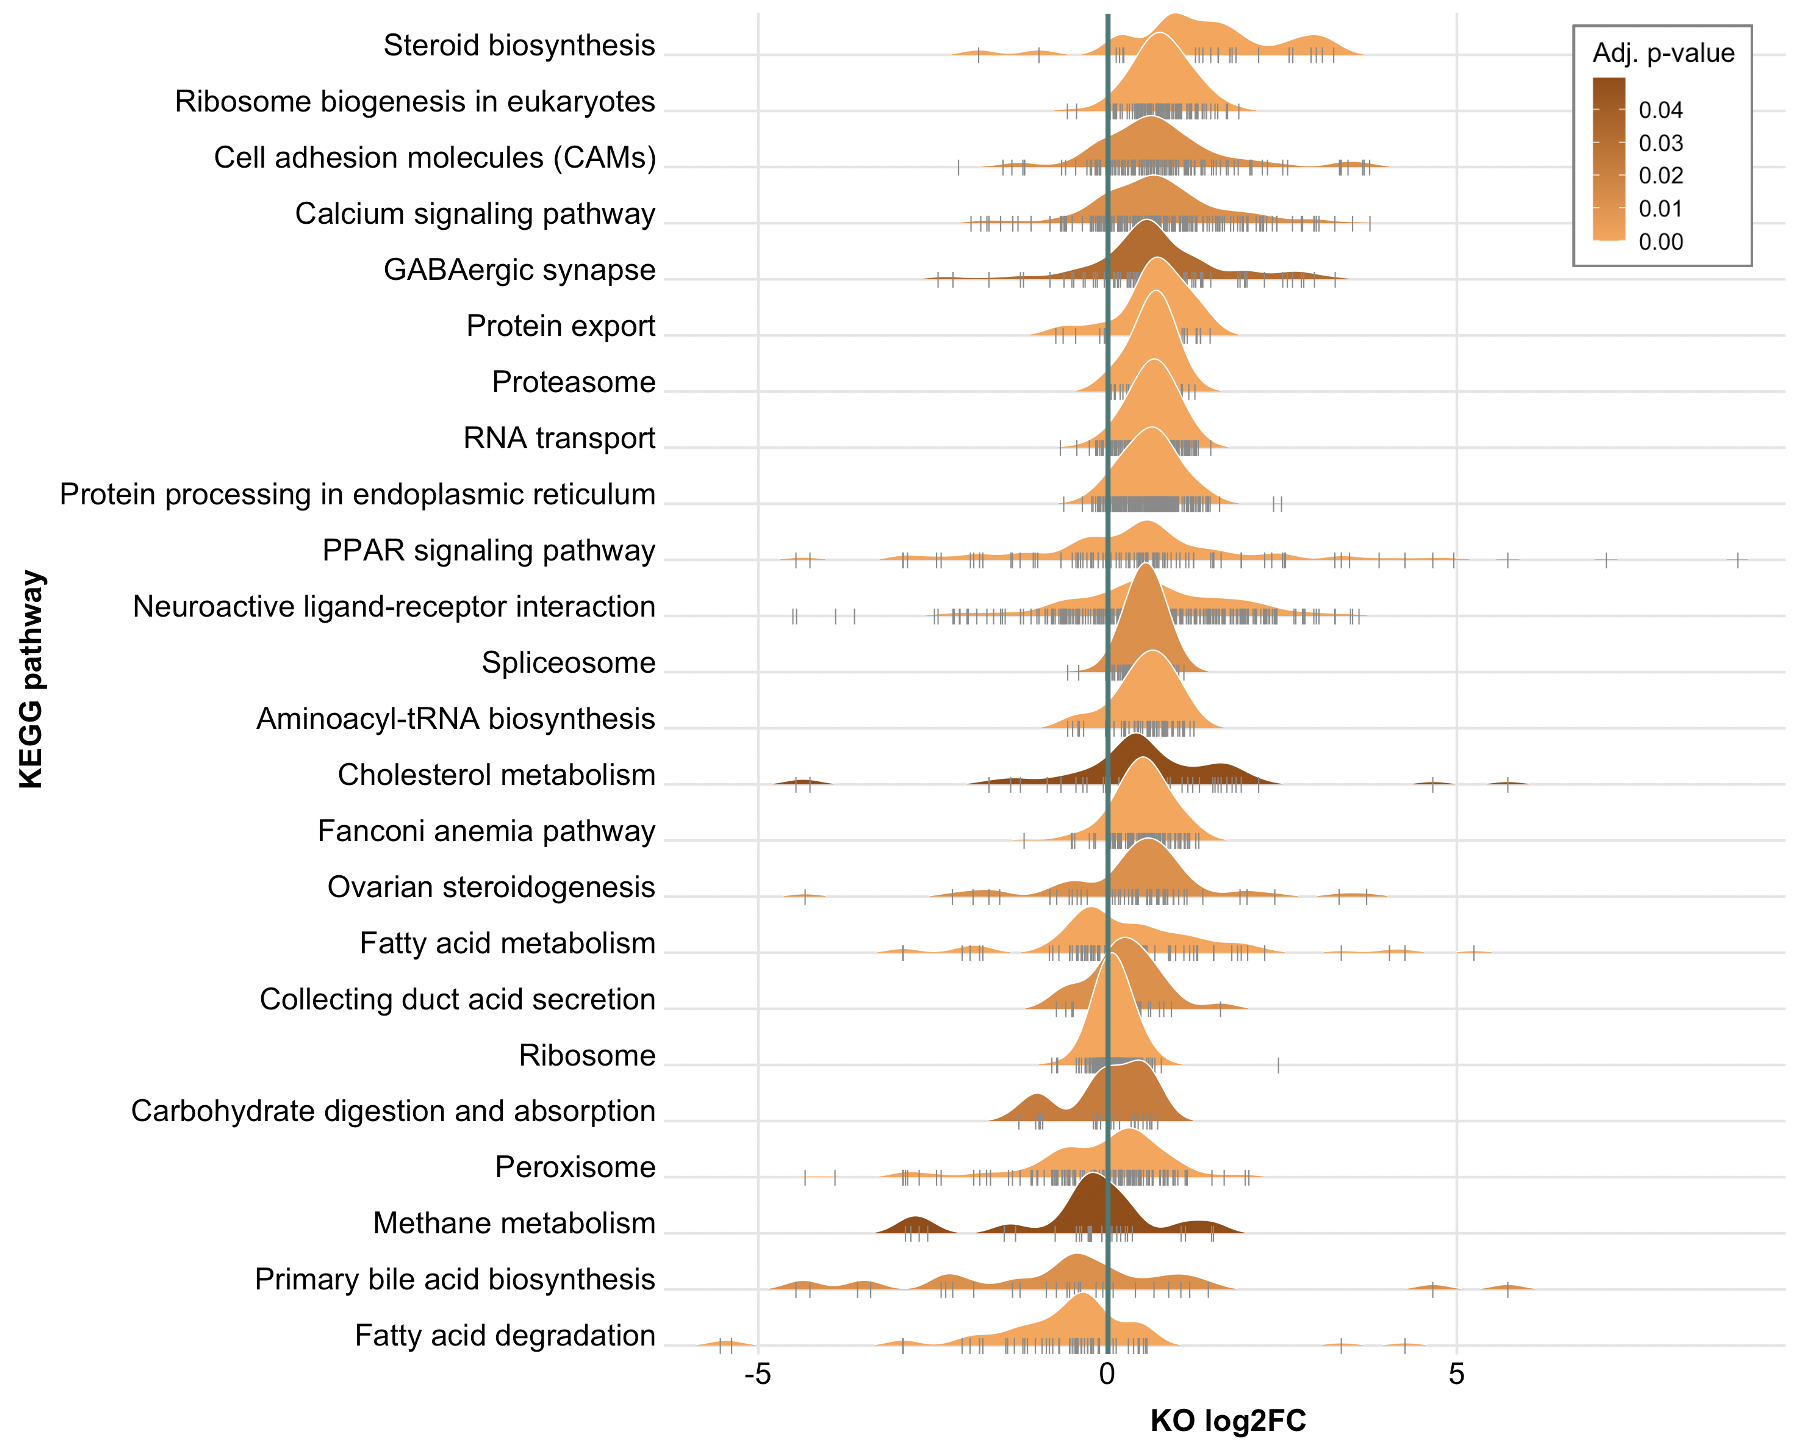
Significantly enriched pathways computed using GSEA for DCCO.
The absolute values of KO log2FCs were used for GSEA.
Pathways were considered significant if the adjusted p-value was < 0.05.
The log2FC of all genes in the enriched pathways are indicated with the vertical grey lines.
The distribution for each pathway is colored according the pathway’s adjusted p-value.